Gaining performance insights using the Intel Advisor Python API
Blog|by James Roberts|3 September 2018

According to a recent article in The Economist, Python is fast becoming the world’s most popular coding language. And the State of the Developer Ecosystem in 2018 report from JetBrains ranked Python as the most popular language that developers have started to learn/continued to learn in the last 12 months.
Python offers itself as a general-purpose language, relatively easy to use with a huge user base with large amounts of documentation. Its straightforward syntax and use of indented spaces make it easy to learn, read and share. Python is the language of choice for fast prototyping, supports asynchronous programming and frameworks.
With thanks to Intel’s magazine “The Parallel Universe“, we can take a close look at how the Intel® Advisor Python API in Intel® Parallel Studio XE provides a way to generate program statistics and reports to help you optimise the performance of your system.
Getting good data to make code tuning decisions
Good design decisions are based on good data:
- What loops should be threaded and vectorised first?
- Is the performance gain worth the effort?
- Will the threading performance scale with higher core counts?
- Does this loop have a dependency that prevents vectorisation?
- What are the trip counts and memory access patterns?
- Have you vectorised efficiently with the latest Intel® Advanced Vector Extensions 512 (Intel® AVX-512) instructions? Or are you using older SIMD instructions?
Intel Advisor is a dynamic analysis tool that’s part of Intel Parallel Studio XE, Intel’s comprehensive tool suite for building and modernising code. Intel Advisor answers these questions―and many more. You can collect insightful program metrics on the vectorisation and memory profile of your application. And, besides providing tailored reports using the GUI and command line, Intel Advisor now gives you the added flexibility to mine a collected database and create powerful new reports using Python.
When you run Intel Advisor, it stores all the data it collects in a proprietary database that you can now access using a Python API. This provides a flexible way to generate customised reports on program metrics. This article will describe how to use this new functionality.
Getting started
To get started, you need to setup the Intel Advisor environment. (For this article, all the scripts were run on Linux, but the Intel Advisor Python API also supports Windows.)
Source: Intel
Next, to set up the Intel Advisor data, you need to run some collections. Some of the program metrics require additional analysis such as tripcounts, memory access patterns, and dependencies.

Source: Intel
To run a map or dependencies collection, you need to specify the loops that you want to analyse. You can find this information using the Intel Advisor GUI or by doing a command-line report.

Source: Intel
Finally, you will need to copy the Intel Advisor reference examples to a test area.
Source: Intel
Note that all the scripts we ran for this article use the Python that currently ships with Intel Advisor on Linux. The standard distributions of Python should also work just as well.
Using the Intel Advisor Python API
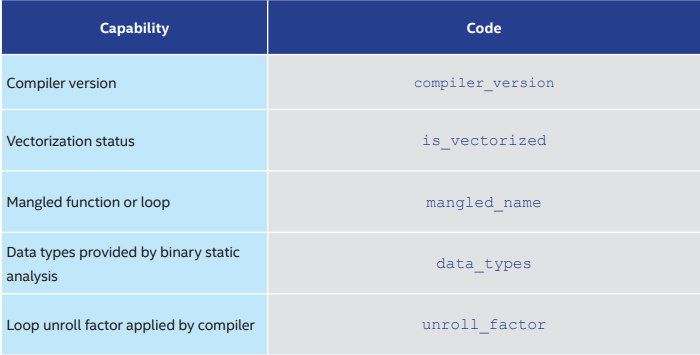
The reference examples provided are just small set of the reporting that’s possible using this flexible way to access your program data. You could use the columns.py example to get a list of available data fields. For example, you could see the metrics in Table 1 after running a basic survey collection.
Table 1. Sample survey metrics
Source: Intel
Intel Advisor Python API in Action
Let’s walk through a simple example that shows how to collect some powerful metrics using the Intel Advisor Python API. The first step is to import the Intel Advisor library package.
Source: Intel
You then need to open the Intel Advisor project that contains the result you’ve collected.
Source: Intel
You also have the option of creating a project and running collections. (In the example below, we’re just doing an open_project.) In this example, we access data from the memory access pattern (MAP) collection. We do this using the following line of code:
Source: Intel
Once we’ve loaded this data, we can loop through the table and gather cache utilisation statistics. We then print out the data we’ve collected:
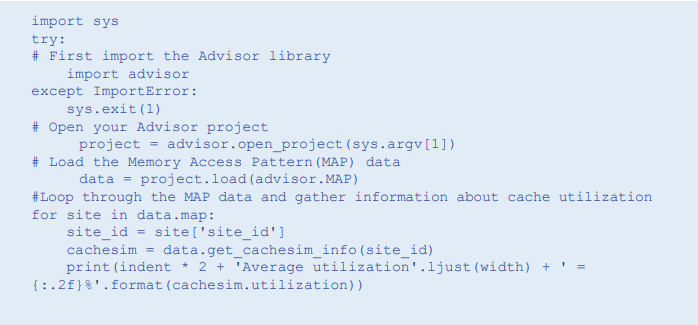
Source: Intel
Intel Advisor Python API Advanced Topics
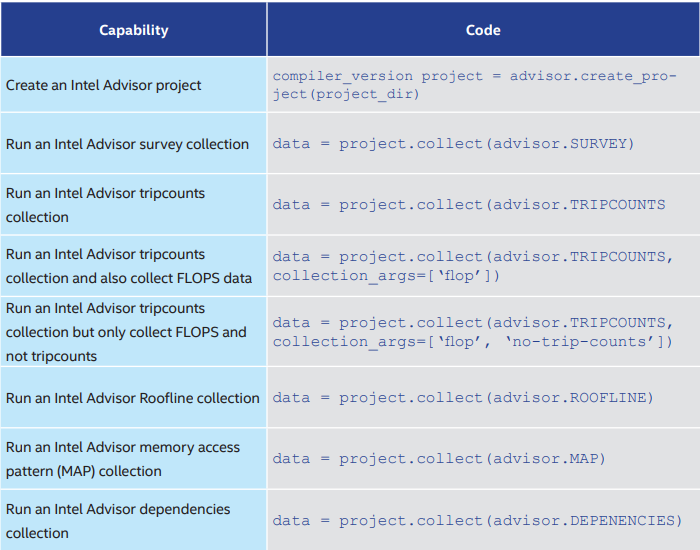
The examples provided as part of the Intel Advisor Python API give you a blueprint for writing your own scripts. Table 2 shows some of these advanced capabilities.
Table 2. Intel Advisor Python API advanced capabilities
Source: Intel
Here are some highlights of various examples. We are constantly adding to the list of examples.
Generate a combined report showing all data collected:
Source: Intel:
Generate an html report:
Source: Intel
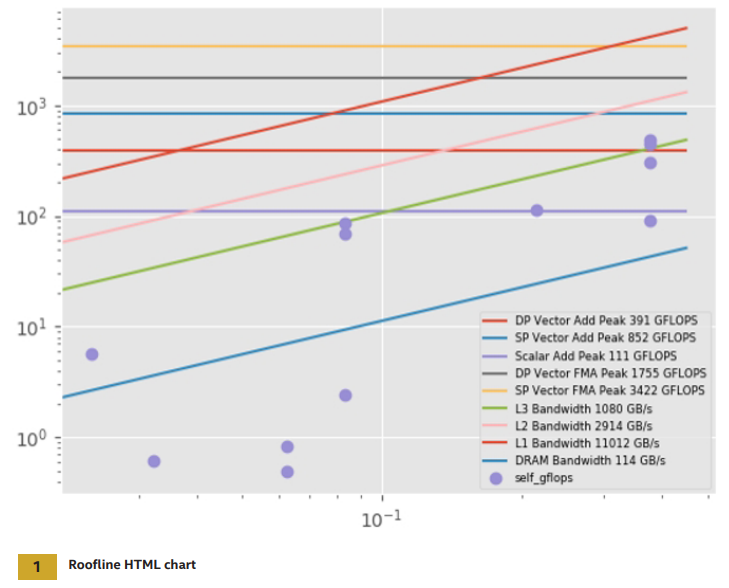
You can generate a Roofline HTML chart (Figure 1) with this code:
Source: Intel
You must run the roofline.py script with an external Python command and not advixe-python. It currently only runs on Linux. It also requires the additional libraries numpy, pandas, and matplotlib to be installed. Use this code to generate cache simulation statistics:
Source: Intel
Source: Intel
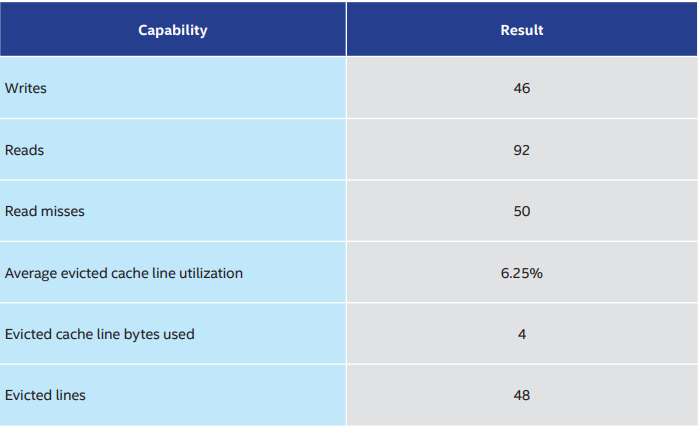
You can see the results obtained from the cache model in Table 3.
Table 3. Cache model results
Source: Intel
Case Study: Vectorisation Comparison
In this case study, we create a Python script that can compare the vectorisation of a given loop when compiled with different compiler options.
Step 1: Compile Code with Different Optimization Flags
First, compile the app with different options. In this example, we use the Intel® C++ Compiler (but Intel Advisor works at the binary level, so any compiler should work). In the first case, we are compiling without optimisation using the compiler option -O0. The second case uses full optimisation -O3.

Source: Intel
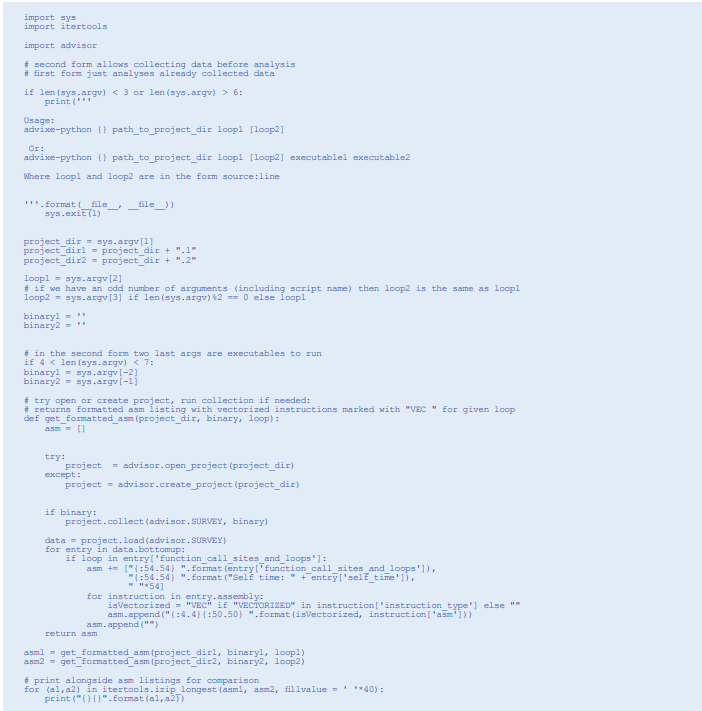
Step 2: The Python Code
The script is very simple. First, get some arguments from the command-line. If they are being passed an Intel Advisor project, then use the data contained in the project. Otherwise, do an Intel Advisor survey run. Once the survey runs complete, decode
the assembly for the loops and print the instructions of the two loops side-by-side. The main function in our Python code is named get_formatted_asm. This function is able to access the Intel Advisor database and decode the assembly for our loops. It can also check whether the assembly code is using vector instructions, as well as how fast the loop executed.
Source: Intel
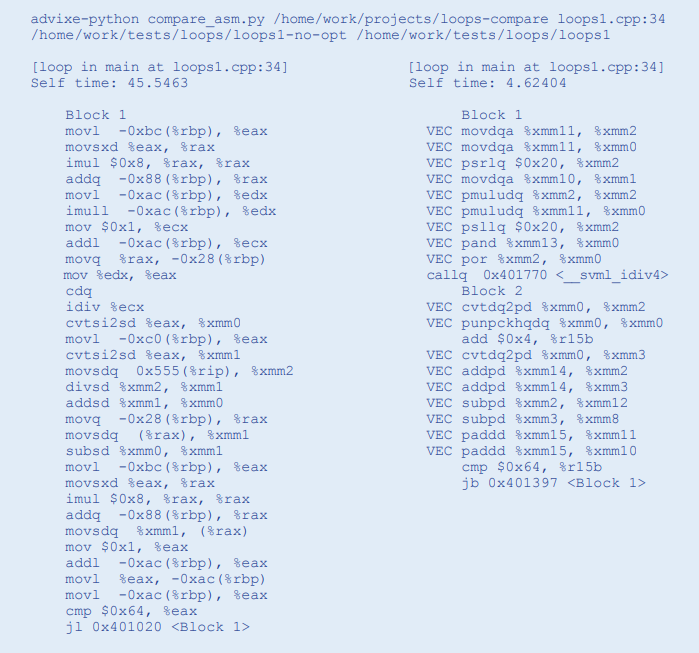
Step 3: Run the Python Script
Source: Intel
Step 4: Recompile with AVX2 Vectorisation
Now let’s try a further optimisation. Since our processor supports the AVX2 instruction set, we are going to tell the compiler to generate AVX2. (You should note that this generally not what the compiler with generate by default.)

Source: Intel
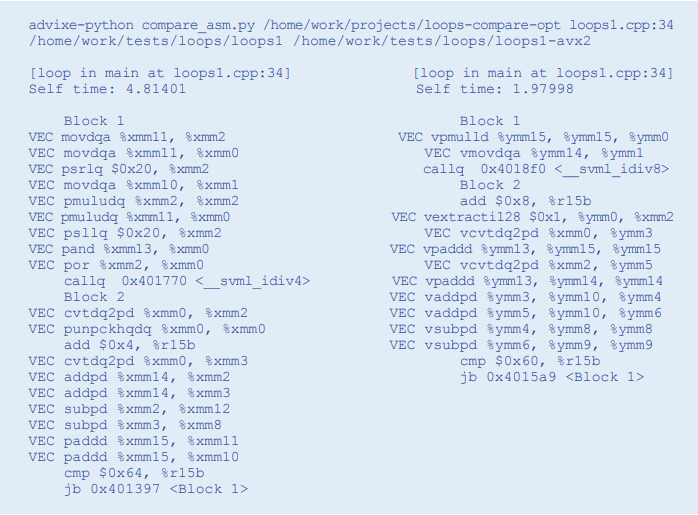
Step 5: Rerun the Comparison
Source: Intel
You can see that the assembly code now uses YMM registers instead of XMM, doubling the vector length and giving a 2X speedup.
Results
The gains we made by optimising and by using the latest vectorisation instruction set were significant:
• No optimisation of -O0: 45.148 seconds
• Optimising -O3: 4.403 seconds
• Optimising and AVX2 –O3 –AVX2: 2.056 seconds
Maximizing System Performance
On modern processors, it’s crucial to both vectorise and thread software to realise the full performance potential of the processor. The new Intel Advisor Python API in Intel Parallel Studio XE provides a powerful way to generate program statistics and reports that can help you get the most performance out of your system. The examples outlined in this article illustrate the power of this new interface. Based on your specific needs, you can tailor and extend these examples. Intel is actively gathering feedback on the Intel Advisor Python API. If you’ve tried it and found it useful, or would like to provide feedback, send email to: [email protected]
Contact Grey Matter
If you have any questions or want some extra information, complete the form below and one of the team will be in touch ASAP. If you have a specific use case, please let us know and we'll help you find the right solution faster.
By submitting this form you are agreeing to our Privacy Policy and Website Terms of Use.
Related News
Microsoft 365 is getting a price update – here’s what’s changing
Microsoft has announced a global pricing update, coming into effect for new purchases and renewals from 1 July 2026. For many businesses, this means higher licence costs – but it also creates opportunities to review, optimise, and in some cases, reduce overall spend. Microsoft 365...
Grey Matter partners with CrowdStrike to expand cyber security portfolio
Ashburton, Devon, UK – 29 April 2026 – We’ve expanded our cyber security portfolio with the addition of the CrowdStrike Falcon® cyber security platform, bringing AI-native protection to help you consolidate cyber security tools, reduce complexity, and stop breaches. As...
A smarter Google Maps alternative for ISVs: why many are switching to HERE
Google Maps Alternative decisions often come down to cost and licensing. See why ISVs shortlist HERE at renewal
Women in Tech Roundtable 2026
Wed 17 June 2026 11:30 am - 3:00 pm BST
Creating space, confidence and connection The technology sector continues to evolve at pace, but progress isn’t just about innovation – it’s about people. That belief sits at the heart of our Women in Tech Roundtable. An event created to champion...