Azure Maps and digital twins
Blog|by Mary Branscombe|20 April 2021
Maps can help you understand the data from sensors more easily by seeing them in context; they also turn out to be the logical way to organise and manage ontologies and hierarchies of smart devices into a smart building.
The new Microsoft Flight Simulator isn’t just a fun way to explore the planet without leaving your house; it’s actually a photorealistic digital twin of the world, using Azure AI tools to turn map data into 3D buildings, roads and vegetation with shadows and reflections that change with the time of day. Play online and the other planes you see, the traffic you fly over, and the weather, all reflect the real world.
What are Digital twins
Digital twins are often thought of as a tool for manufacturing and smart factories: you can use a digital version of a product in simulations for testing long before you build the physical project, to refine the design or build the software services that will work with it. Digital twins for the machinery that builds the physical product, lets you design, simulate and optimise the manufacturing line without moving equipment around (or even owning it), as well as monitoring the production line in operation and predicting the best time to do pre-emptive maintenance. Digital twins can reflect anything from an individual component like a rotor blade to an asset like a motor or turbine, to the system it’s part of like an airplane, to the manufacturing process that builds any of those, to an entire smart building.
Watch the recording of our Azure Maps webinar, The Location of Things: Smart Cities with Azure Maps, IoT and Digital Twins over on our YouTube channel, link here
In fact, as Flight Simulator shows, you can have a digital twin for anything in the physical world – and maps are a key part of the solution, because the location of an item you’re twinning digitally can be as important as any other attribute.
Even for industrial machinery, you need to know the dimensions of the room, the position of any pillars or other obstructions, the locations of power supply of the right voltage, maybe water connections or drains, other machinery that might have an impact on it or whether the safety radius for the machine will put someone operating or inspecting it in an unsafe position like a narrow walkway or in the path of a delivery robot.
As autonomous systems like cleaning robots become more common, connected as IoT edge devices, location information and mapping will become more important. Factory robots need to know where they are and where they’re going, but they also need to know where other robots are and when you get robotic devices from different suppliers they often can’t communicate directly. The best common schema to use for internal systems and geometric infrastructure alike turns out to be a map.
Mapping a smart building
Indoor mapping using Azure Maps Creator lets you build a digital twin for an entire building to create solutions for everything from asset management and facility mapping (for manufacturing, healthcare or services like fire and police) to retail analytics and understanding how space is used in an office.

You can use Azure Maps Creator to develop applications with map features based on indoor map data. The entire workflow of uploading, converting, creating, and using your map data is illustrated in this diagram. Source: Microsoft
Creator takes indoor floor plans in CAD format and turns them into a tile-based vector format you can use for visualisation overlaid on the satellite imagery from Azure Maps. The vector format renders quickly and can be queried and styled using a web service.
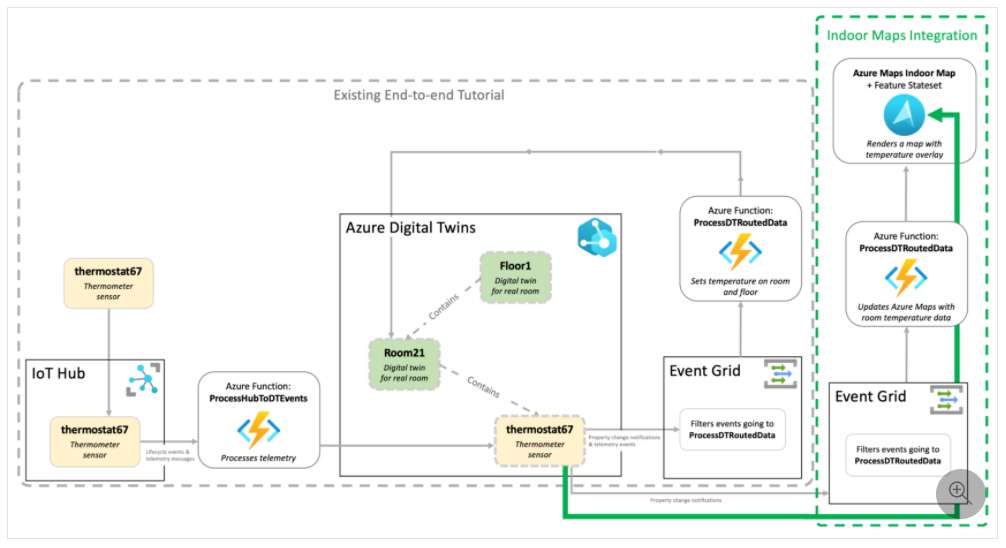
But because it’s about creating smart buildings, Creator also connects them to the Azure Digital Twins service and IoT Hub to bring the indoor map to life with real time sensor data.
For asset tracking, you can set geofences in Azure Maps and create a notification via Azure Event Grid when the device enters or leaves a geofence.
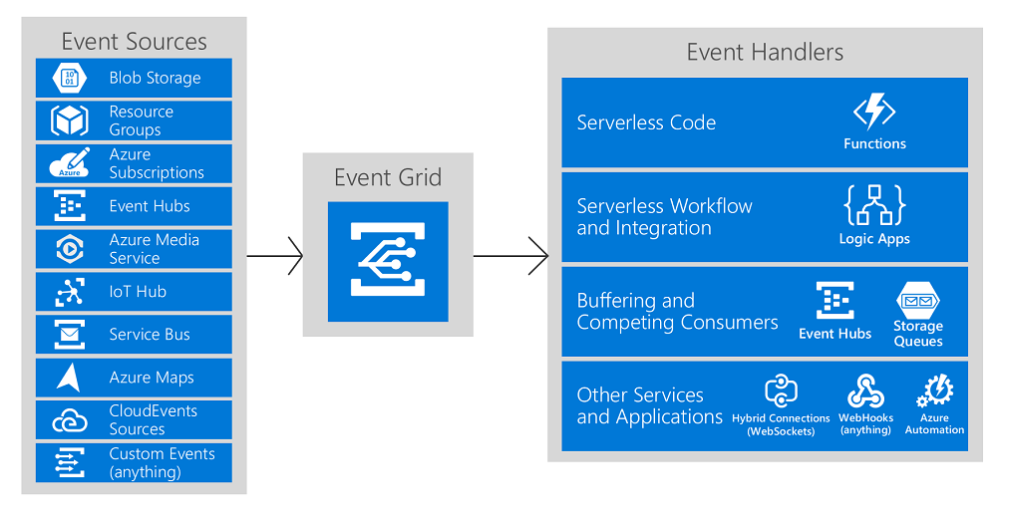
Details of electrical and ventilation systems, water pipes, smoke sensors, fire suppression systems or even the chairs in a meeting room can be stored as data in a graph and referenced as layers in the map, with the geometry of that infrastructure and the relationship to other digital twins: a floor contains a room, an HVAC cools a room and a room contains a chair or a thermostat or a window. That can be used for visualisation, automation or – soon – indoor routing.
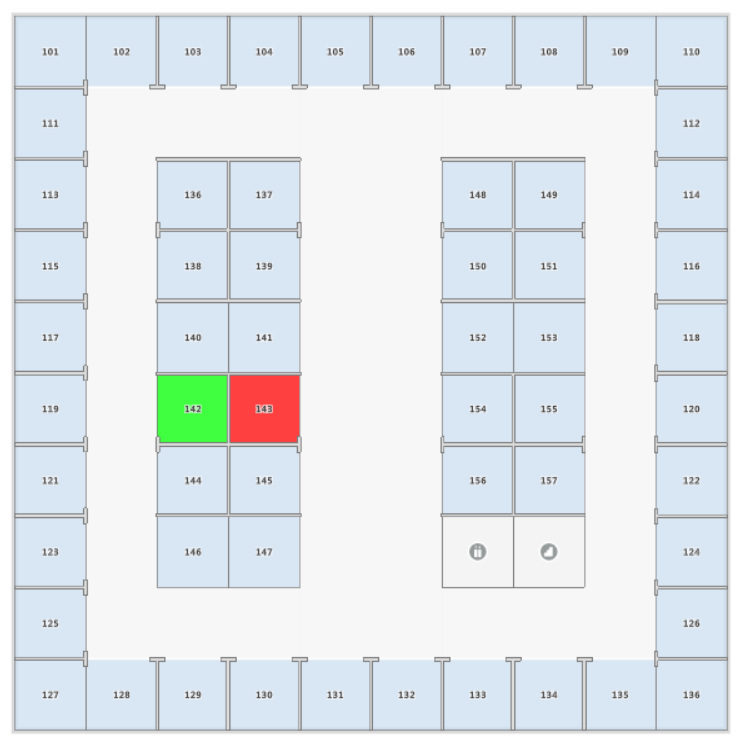
You can go from looking at the schematics for your thermostats to seeing the temperature in different rooms colour coded on the map or checking on the air quality and how many people are sitting in a room (using pressure sensors in chairs or an occupancy sensor and computer vision spatial analysis), all delivered as data from IoT Hub via Azure Functions.
Microsoft uses privacy-protecting presence sensors in meeting rooms on its Redmond campus to detect how many people are in a room when there’s a meeting booked. An Exchange flag can show whether the room is empty even though there’s a meeting booked so it’s available for others to use (or occupied even though there’s no meeting booked, so it won’t be suggested when someone is looking for space to meet in). Seeing that all ten chairs in the room are already occupied while you’re still on your way to a 20 person meeting – or even before you leave your desk – lets attendees save time by dialling in instead.
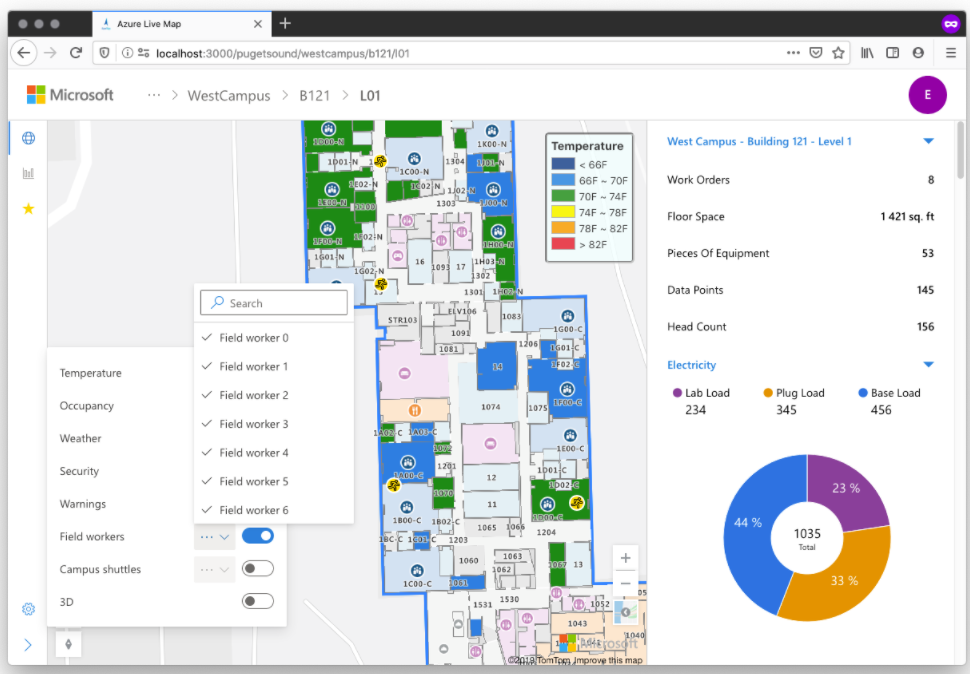
Occupancy information will become increasingly important as workplaces begin to reopen, especially given the importance of ventilation and airflow for controlling COVID-19 spread, and some Azure customers who are using Azure IoT Hub for smart building monitoring have already started investigating Azure Digital Twins and Maps Creator to simulate occupancy patterns and prepare to do contact tracing. Determining that there was a person in a particular location and using, for example, Wi-Fi router connections to determine their path through the office and cross-referencing that with other people in a privacy-preserving way will allow for contact tracing or determining areas of a facility that may be more prone to infection.
(One of the important points about Creator is that the map data organisations create with it remains private and the Azure services they can use with that map data comply with the regulations that will apply to these kinds of process.)
Wayfinding and routing inside buildings will be helpful for robotics and autonomous systems, but also for field service and shipping, and even for new employee orientation. When a technician needs to replace a single valve on a pipe in a wall, with up to 18 points of precision in the latitude and longitude of the location, indoor mapping can direct them to the specific square foot on the wall where they will be working, rather than leaving them to decipher the building diagram to track down the fault.
In the long run, you’ll be able to connect the external and inside routing capabilities for complete end-to-end routing. Imagine sending a product from the factory where it’s made, to a port, onto a ship, loaded onto a train or truck and delivered all the way to the customer’s loading dock, with sensor data along the route checking that temperature sensitive cargo always stays in compliance.
How to store digital twin geodata
For each digital twin, you need to collect, store, reference, update and present data, and that’s something Azure Maps is very good at, whether the data comes from a database of addresses, a sensor or a robot trundling around a warehouse – as well as the visualisation that makes it easy for people to understand the state of the physical object in the context of its location in the facility. Knowing that a door is open is useful; knowing that it’s the back door to the loading dock when there’s no collection or delivery scheduled and it’s raining is even more useful (especially if you can close it automatically).
Digital twin information in Azure Digital Twins (and in IoT Plug and Play) is written in the Digital Twins Definition Language (DTDL v2) and stored in a JSON file that has the state information for the device, the object model with device protocols and data schema and a spatial graph using the GeoJSON schema that represents the physical environment and models the relationships between devices, places and even people in a categorised ontology for smart buildings. If you haven’t created smart building digital twins before, the open source RealEstateCore ontology for Azure Digital Twins is a good place to start.
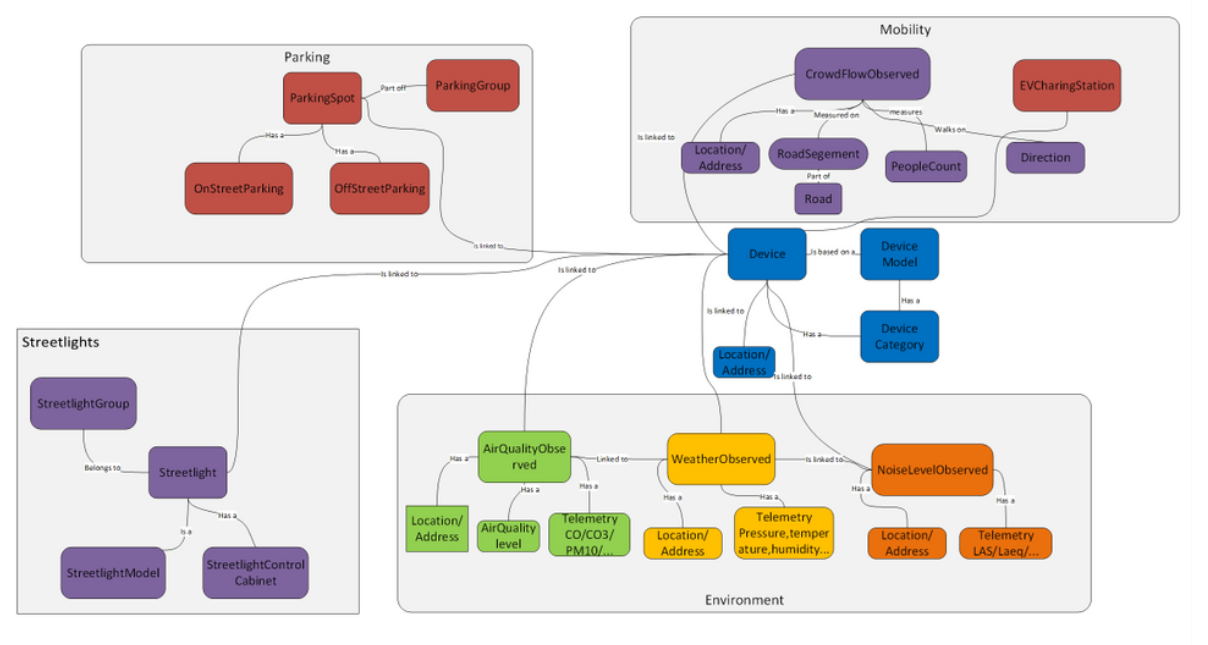
Storing information as a graph means you can have multiple floors in the building that you can switch between in a visualisation: on a specific floor you can pick a room and then an object in the room and retrieve the metadata for each of them. Different rooms could have a different style on the map to show what kind of room they are – office, manufacturing floor, shipping or shared areas like kitchens and bathrooms. Because location is first class data in the digital twin schema, you can filter sensors by location to get just the ones you’re interested in without having to write code to do complex geometric processing. But there are also spatial algorithms you can use to find the sensor or other IoT devices closest to a particular location you’re interested in.
That data can also be used in other services like Azure Machine Learning and Azure Stream Analytics for further analysis, or brought into Dynamics 365 for applications like field service and appointment bookings, or linked in the new Viva Connections app in Teams to help new employees find their way around the office.
It could also be used with Microsoft’s Mixed Reality services. Azure Maps already manages 3D data and works with spatial anchors and Azure Maps Creator will be a logical place for storing and managing all that data. Spatial maps can be as granular as how the lines are routed in a turbine or a car engine, which can be visualised in the new Microsoft Mesh service or on a HoloLens.
As detailed building information models become available for more locations, 3D map interfaces that better align 3D content to real-world objects will become extremely powerful. Prepare for that by looking at how you can start creating smart buildings with Azure Maps Creator.
Grey Matter is an Azure specialist with a team of mapping experts and cloud architects who can discuss your use case and get you set up on Azure, Azure IoT and Azure Maps. Contact them: [email protected] / +44 (0)1364 655 133.
Contact Grey Matter
If you have any questions or want some extra information, complete the form below and one of the team will be in touch ASAP. If you have a specific use case, please let us know and we'll help you find the right solution faster.
By submitting this form you are agreeing to our Privacy Policy and Website Terms of Use.
Author
Mary Branscombe
Independent Writing and Editing Professional at Freelance
Mary is a technology journalist with over three decades of experience, regularly contributing to CIO.com, The New Stack, Computer Weekly, The Stack, AskWoody and more. She specialises in Microsoft, authoring two books on Windows 8 and one O'Reilly book on Azure AI services with writing partner, Simon Bisson.
Related News
Cyber security in 2025: What we learned and how to stay ahead in 2026
Why human factors, AI, and compliance will define the next era of cyber defence 2025 was a turning point for cyber security. From headline-grabbing breaches to the rise of AI-driven attacks, businesses faced unprecedented challenges. So, what can you learn – and how can...
Mapping as a security function
Mapping has become a core part of modern security. Azure Maps and HERE give organisations the privacy, governance and geospatial insight they need to protect data, strengthen threat awareness and secure day-to-day operations.
Five insights to strengthen your DevSecOps strategy
Security isn’t an add-on. It’s an integral part of how you build, test, and deliver software. That’s what’s at the heart of DevSecOps – and why it matters for every modern development team. In season three of Grey Matter Talks Tech, we sat down with Richard Fennell, CTO at Black Marble,...
HERE Tour Planning for festive freight
HERE Tour Planning for festive freight turns multi‑vehicle chaos into efficient, on‑time deliveries with fewer miles and happier drivers.